Reporting Guide
This guide shows how to build and manage Traceability reports from the YouTrack main menu.
Open the Reporting View
Open Traceability reports from the YouTrack main menu.
The report screen combines:
- a saved reports sidebar
- report setup for the X and Y axes
- view preferences
- a directional traceability matrix
- export actions
Build Your First Report
Step 1: Choose the X Axis Scope
The X axis scope defines which issue set appears in the matrix columns.
Step 2: Choose the Y Axis Scope
The Y axis scope defines which issue set appears in the matrix rows.
Step 3: Run the Report
Click Run report to load both scopes and build the matrix.
The app fetches all available link relations for the selected axes and then lets you refine the visible relation set locally.
Supported Scope Modes
Both axes support the same scope modes:
- Project
- Query
- Saved query
- Assignee
- Reporter
- Agile
- Tag
Use the same scope on both axes when you want a self-comparison matrix, or choose different scopes when you want a cross-team or cross-process traceability view.
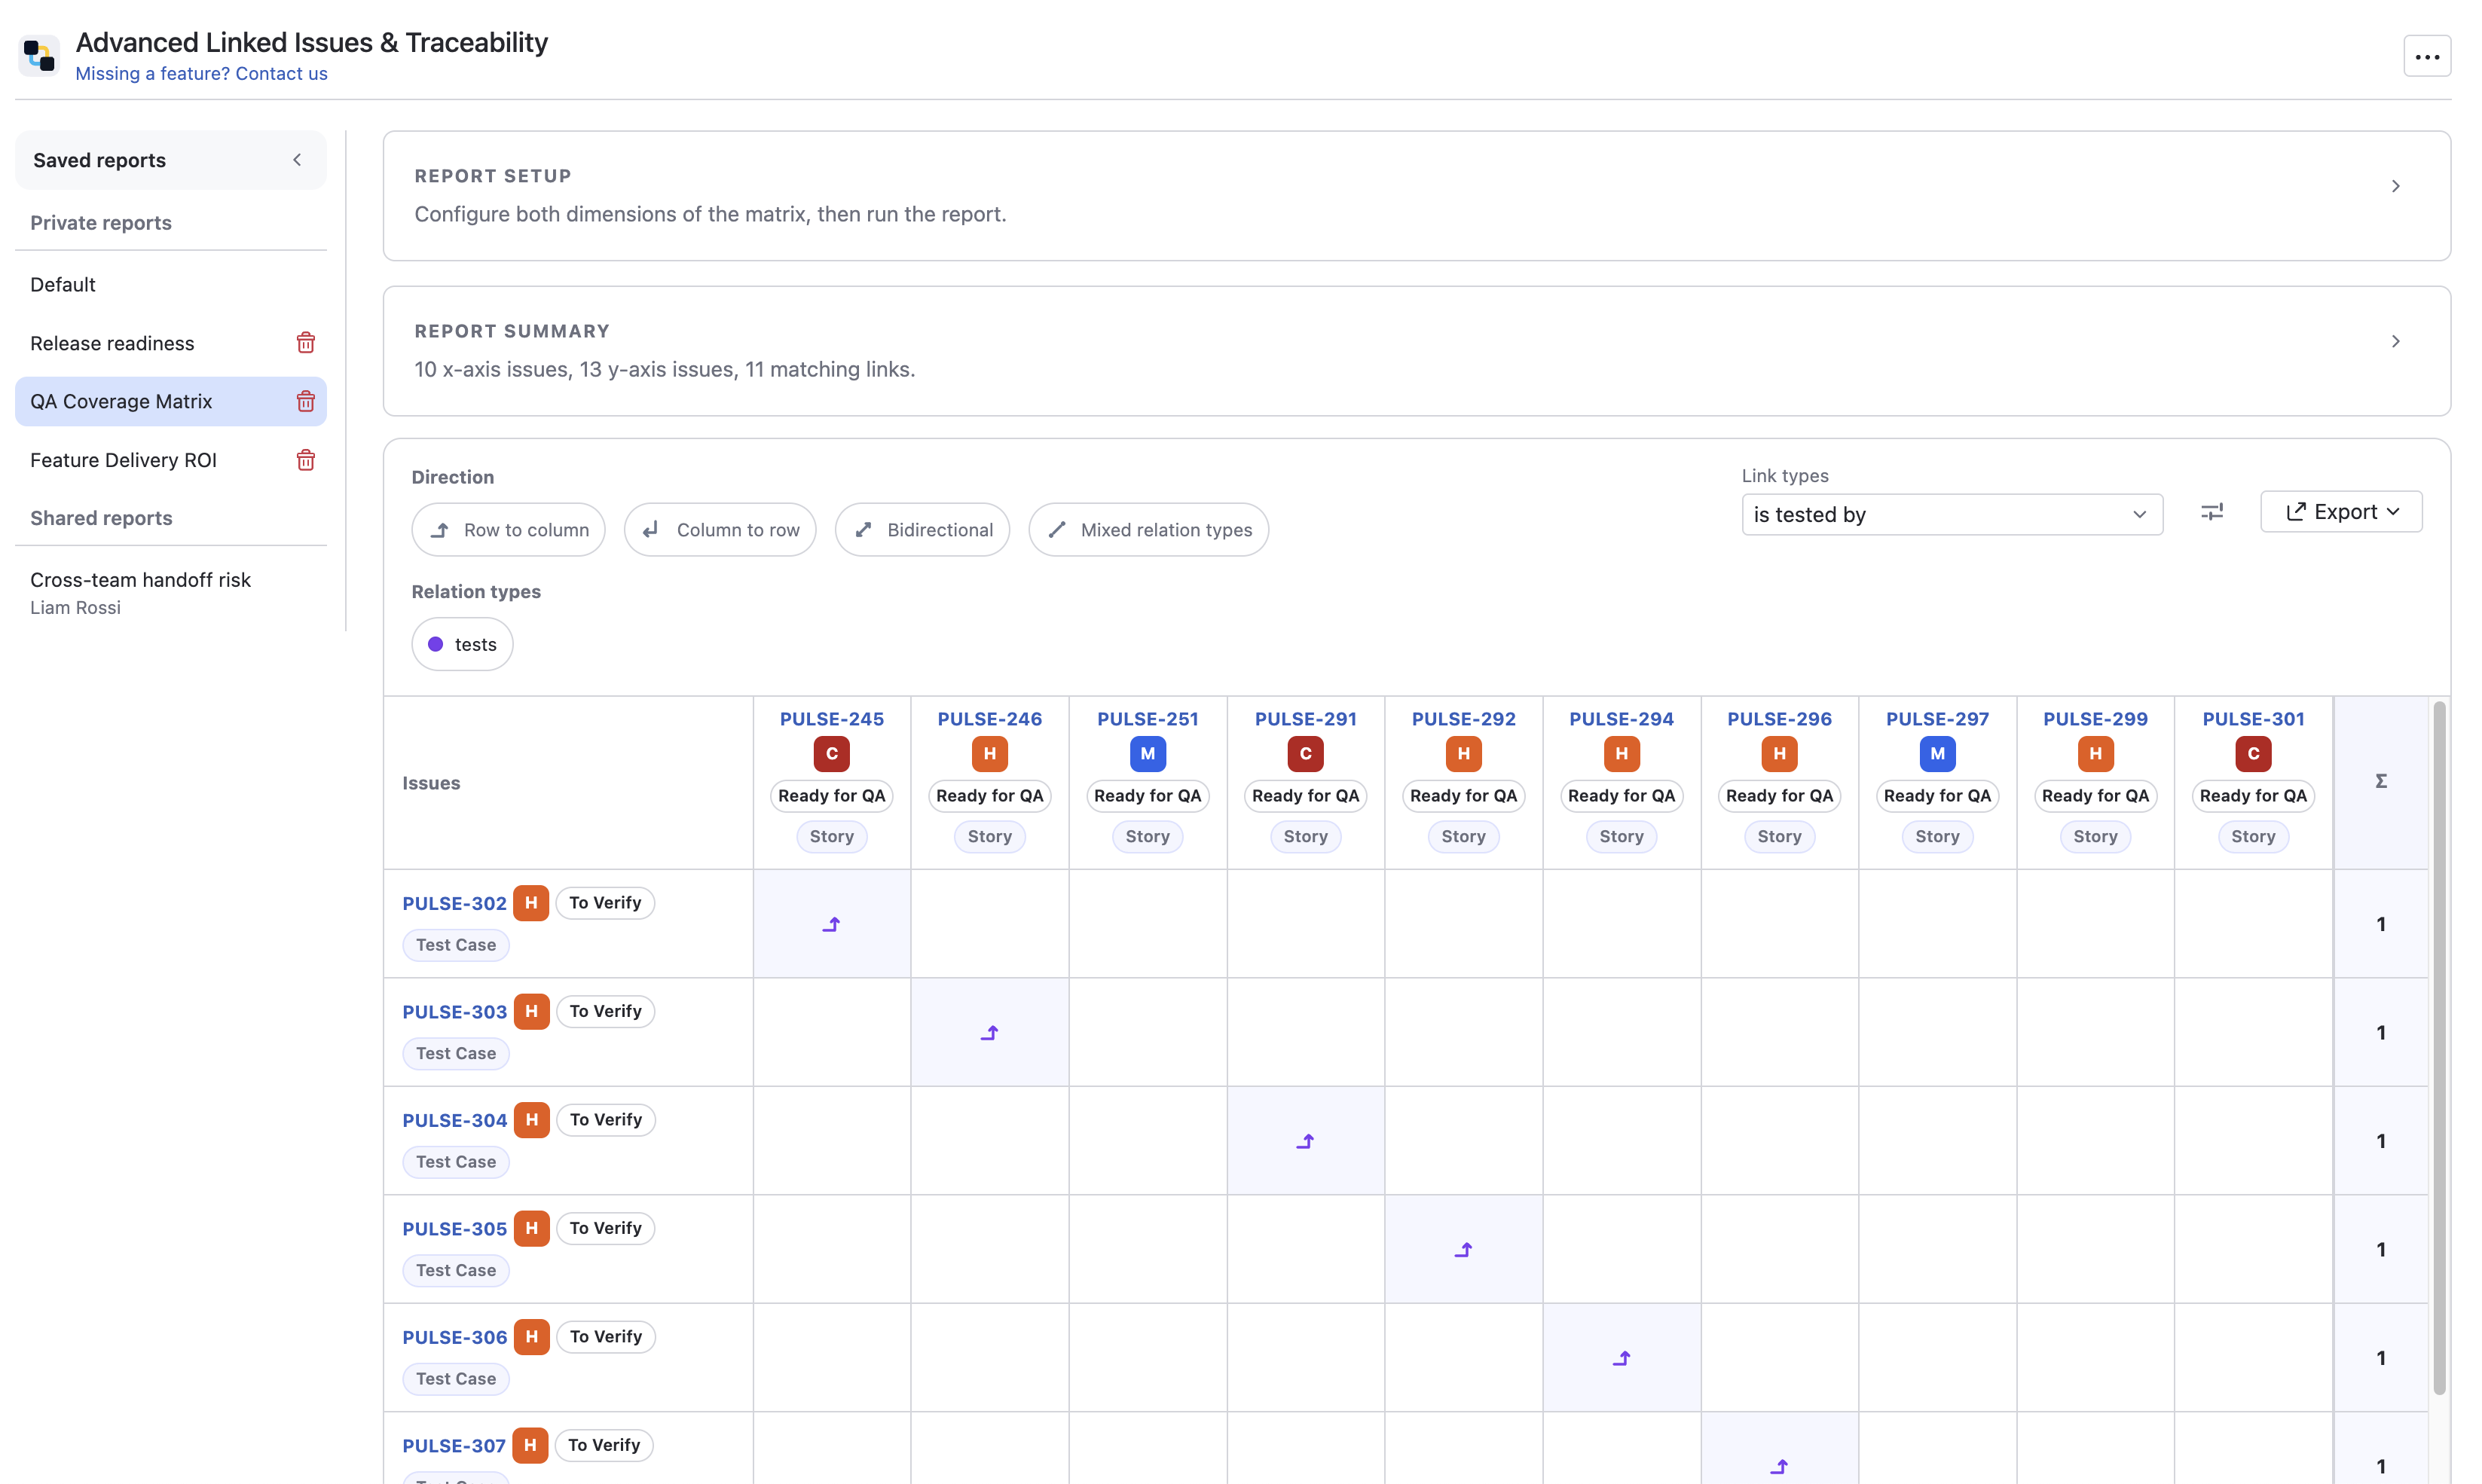
Understand the Matrix
The traceability matrix is directional.
- rows represent the Y axis
- columns represent the X axis
- a relation appears in the cell that matches its stored direction
This means the matrix does not mirror one relationship automatically into both opposite cells.
Directional Link Types
The Link types filter is also directional. Instead of one generic relation type, the filter shows the visible side of the relationship, for example:
parent forsubtask ofrequiresis required for
This keeps the filter consistent with the matrix itself.
Use Report Setup
The setup section lets you define:
- X axis scope
- Y axis scope
- link types
- view preferences
The setup and summary sections can both be collapsed after you configure them.
Use View Preferences
The View preferences popup controls how issue labels and matrix metadata are displayed.
Available options:
- Summary
- Status
- Issue type
- Priority
- Show aggregations
- Density
Density options:
XSSMLXL
These settings are stored in saved reports together with the selected scopes and link-type filter.
Read the Summary Section
The Report summary section shows:
- issue counts for both axes
- matching link count
- X axis coverage
- Y axis coverage
- issue-type coverage cards for both axes
Use it to understand quickly how much of each issue set is actually connected before reading the full matrix.
Work with Saved Reports
The left sidebar stores reusable traceability reports.
Saved report types:
- Default
- Private reports
- Shared reports
Save
Use Save to overwrite the currently selected report if you are allowed to edit it.
Save As
Use Save as to create a new saved report from the current setup.
Discard Changes
Use Discard changes to restore the last saved version of the selected report.
Automatic Report Loading
When you open a saved report from the sidebar, the app:
- restores the saved setup
- automatically runs the report
- shows the current results
Manage Links from the Matrix
Click any matrix cell to open the Manage links popup next to that cell.
From there you can:
- inspect existing links between the two issues
- choose a direction
- choose a link type
- create a new link
- delete an existing link
The popup is anchored to the clicked cell, so it opens near the matrix location you are already working on.
Export Results
The report supports:
- Export to CSV
- Export to XLSX
Export uses the currently visible result state, including the active traceability matrix content.
Practical Use Cases
Requirements to Verification Matrix
Put requirements on one axis and verification issues on the other to see which requirement rows still lack linked follow-up work.
Team Handoff Audit
Compare issues reported by one group against issues assigned to another group to understand whether formal handoff links exist.
Saved Review Packs
Create one shared report for weekly release readiness, another for QA coverage, and reopen them without rebuilding the scope every time.
Troubleshooting
I changed the filter and now the matrix looks different without rerunning
That is expected. Link types and View preferences refine the loaded result locally after the report has already been fetched.
The same issue pair is not filled in both opposite cells
That is also expected. The matrix is directional, not mirrored. The visible cell depends on the stored direction of the link.
I changed a saved report and now I see "Unsaved changes"
This appears whenever you change:
- X axis scope
- Y axis scope
- link types
- view preferences
Use Save, Save as, or Discard changes.
The popup closed while I was working with a cell
The link popup is tied to the current cell position. Scrolling or resizing the viewport can close it so the popup does not drift away from its anchor.
Need help configuring the defaults first? Go back to the Admin Guide.