Reporting Guide
This guide shows everyday users how to build, read, save, and export Time in Status reports from the main menu inside YouTrack.
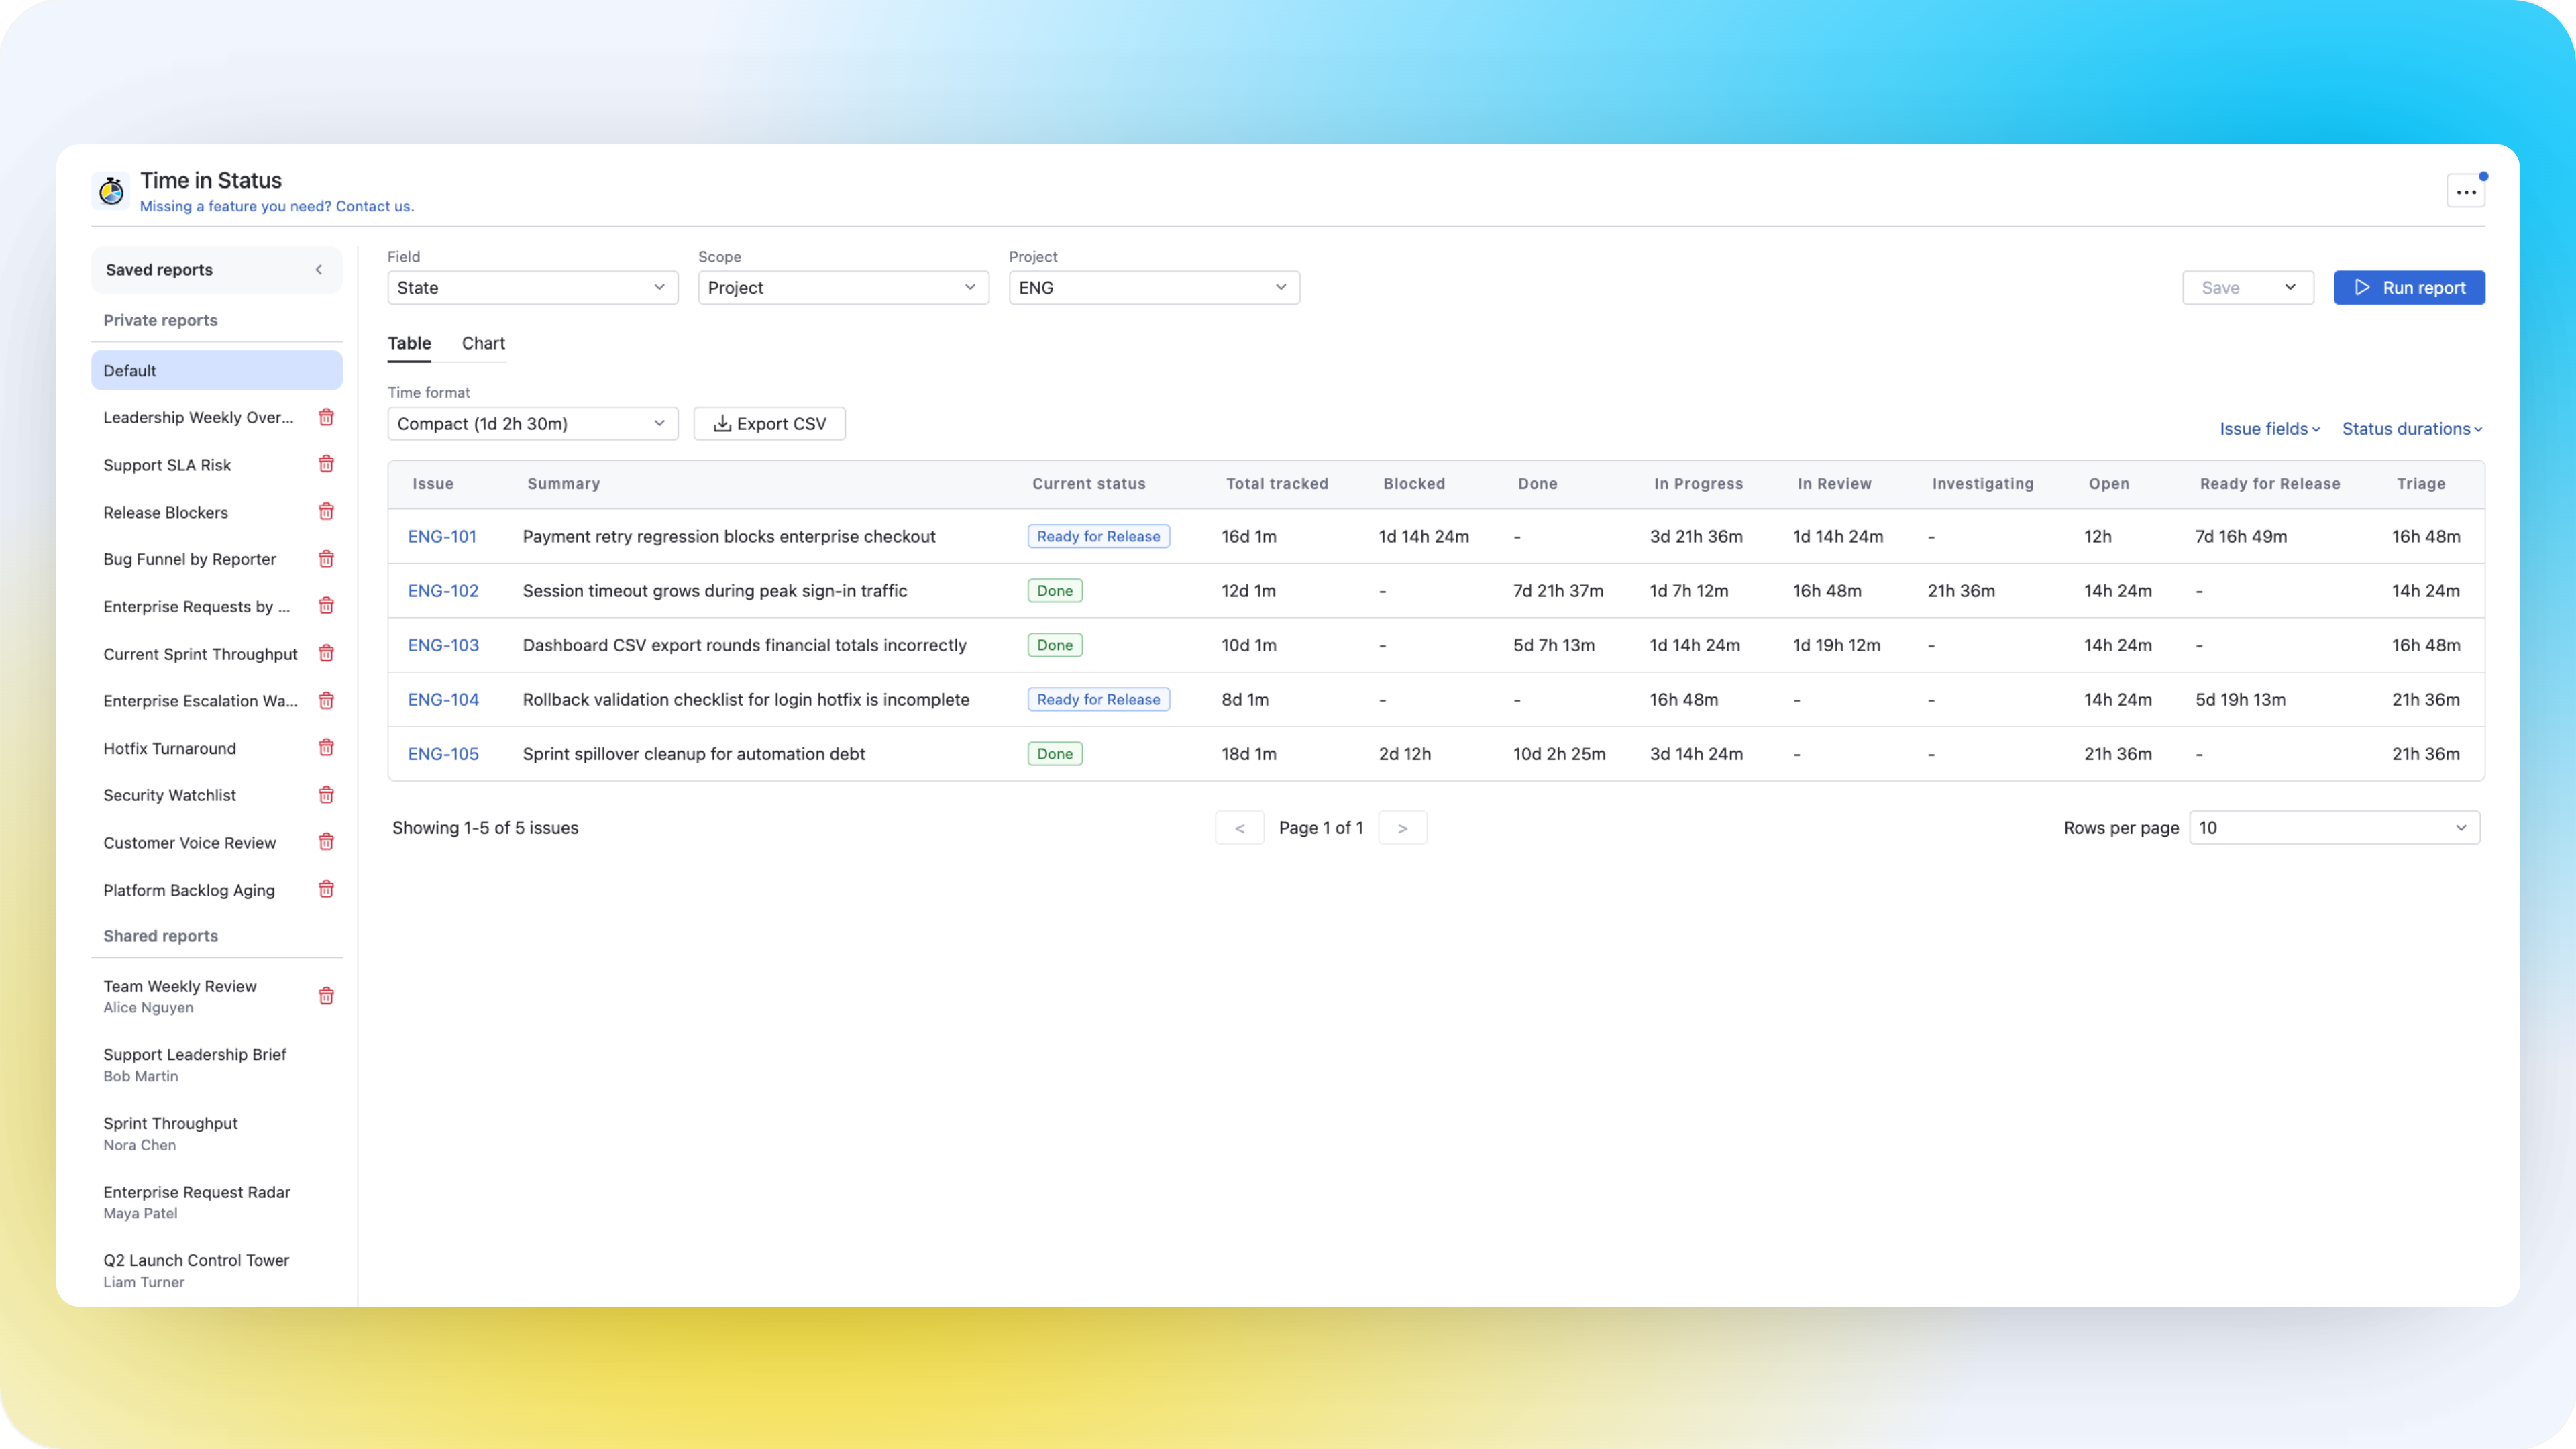
Open the Reporting View
Open Time in Status from the YouTrack main menu. The report screen lets you choose:
- the tracked state field
- the report scope
- the output view
Build Your First Report
Step 1: Choose the Tracked Field
Use the Field selector to choose which state-type field should be treated as the tracked workflow field.
In many installations this will be the standard State field, but your administrator may have configured a different default.
Step 2: Choose the Scope
Use the Scope selector to decide which set of issues should be analyzed.
The app supports these scopes:
- Project
- Query
- Saved query
- Assignee
- Reporter
- Agile board
- Tag
Step 3: Provide the Scope Value
Depending on the selected scope, fill in the matching input:
- Project: choose a project
- Query: enter a YouTrack search query
- Saved query: choose one saved query
- Assignee / Reporter: select one user
- Agile board: choose a board and sprint
- Tag: choose one tag
Step 4: Run the Report
Click Run report to refresh the result.
Choosing the Right Scope
Project
Use Project when you want a broad operational view of one team's work.
Query
Use Query when you need the most flexible filtering, for example:
- only unresolved issues
- only tickets with a specific type
- only issues updated recently
Saved Query
Use Saved query when your team already has a stable YouTrack query for recurring reviews.
Assignee or Reporter
Use these scopes when you need a person-based view of waiting time.
Agile Board and Sprint
Use the agile scope for sprint reviews, flow reviews, and delivery follow-ups tied to a board.
Tag
Use tags when you group issues by process, escalation type, customer segment, or internal triage labels.
Work with the Table View
The Table view is the best choice when you need issue-level detail.
It includes:
- issue identifier
- summary
- current status
- status duration columns discovered from the current result set
- total tracked time
- optional extra issue fields from YouTrack
Change Visible Columns
Use the column selectors to control:
- which issue fields are visible
- which status duration columns are visible
By default, the table starts with the core issue columns and the discovered status duration columns for the current result set.
Reorder Columns
You can drag and reorder columns to match the reading order your team prefers.
This is useful when you want, for example:
- issue identifiers first
- business fields such as priority or assignee near the front
- status duration columns grouped in the order your workflow uses
Sort the Table
Sorting is applied to the underlying YouTrack query before the report is loaded again.
Change Page Size
The table supports these page sizes:
102550100
Use a smaller size for focused analysis and a larger size when scanning many issues quickly.
Export to CSV
Click Export CSV to download the visible table columns.
Important details:
- the export respects the current scope
- the export respects the current sorting
- the export uses the visible columns
- CSV export is limited to the first 1000 issues
If the scope contains more than 1000 issues, the app warns that only the first 1000 were exported.
Work with the Chart View
The Chart view is the best choice when you want to present the overall distribution of time across statuses.
Switch Chart Type
The chart view supports:
- Bar
- Column
- Pie
Choose the format that best fits the audience:
- bar and column charts work well for comparison
- pie charts work well for broad distribution snapshots
Show Values
Enable Show values when you want the chart to display explicit duration labels instead of relying only on relative bar or slice size.
Hide Statuses from the Legend
Each legend item can be toggled on or off. This is useful when:
- one long-running status dominates the chart
- you want to compare only a subset of statuses
- you need a simplified chart for stakeholders
Export to SVG
Click Export SVG to download the visible chart as a vector file.
SVG export is useful for:
- presentations
- internal reports
- documentation
Why Chart View Can Take Longer
Chart mode processes the full scope, not only the currently visible page. That means it may take longer than table mode on large datasets.
Save and Reuse Reports
The left sidebar stores reusable report setups.
The app supports:
- Default report
- Private reports
- Shared reports
Save Changes to the Current Report
Use Save when you want to update a report you own.
Typical examples:
- you changed the default time format for that report
- you adjusted visible columns
- you switched from table to chart view
Create a New Saved Report
Use Save as when you want to create a new report from the current setup.
You will be asked for:
- Report name
- whether the report should be Public report
Private vs Shared Reports
- Private reports are visible only to you
- Shared reports are visible to other users on the same instance
Ownership Rules for Shared Reports
Shared reports have an owner.
- the owner can update and delete the shared report
- other users can open the shared report, but they cannot overwrite or delete it
Unsaved Changes
If you change a saved report, the UI shows an Unsaved changes indicator. You can then:
- save the changes
- use Save as to branch the report into a new one
- discard changes
Practical Use Cases
Weekly Delivery Review
Create a shared report for the current sprint and switch between table and chart view during the meeting.
Bottleneck Analysis by Query
Use a query-based report to isolate only blocked, escalated, or overdue issues and see which status consumes the most time.
Manager Snapshot
Use the chart view and export SVG to share a clean visual summary with stakeholders.
Agent or Developer Follow-up
Run an assignee-scoped report to inspect how long one person's tickets remain in review, testing, or waiting states.
Troubleshooting
No issues found
- Check whether the selected scope actually returns issues
- For query-based scopes, verify the YouTrack query
- For agile scope, verify the selected board and sprint
Some status columns are missing
Status duration columns are discovered from the issues returned by the current report. If no issue in the result set used a status, that status will not appear as a discovered duration column.
Chart view looks different from the first table page
That is expected. The table shows one page at a time, while the chart aggregates the full scope.
Next step: If you need to analyze a single issue instead of a whole scope, continue with the Issue Panel Guide.