Dashboard Guide
The Customer Satisfaction (CSAT) dashboard widget brings satisfaction analytics directly into your YouTrack dashboards. Add one or more widgets to visualize overall metrics, assignee performance, or individual feedback entries.
Adding a Dashboard Widget
- Open any YouTrack dashboard
- Click Add widget → Customer Satisfaction (CSAT) Dashboard. This requires permission to create and configure CSAT reports.
- The widget opens in configuration mode — select a report mode and save
- The widget renders the selected report with data from your CSAT surveys
You can add multiple instances of the widget to the same dashboard, each configured with a different report mode or filter set.
Dashboard Permissions
App administrators can control who can view CSAT dashboard reports and who can create or configure report widgets. If you can see the widget but cannot view or edit a report, ask an app administrator to review Dashboard Permissions in the CSAT administration settings.
Report Modes
Each widget instance displays one of three report modes:
Overall Report
The Overall report provides a high-level view of your satisfaction metrics with four components:
| Component | Description |
|---|---|
| Happiness Gauge | Visual gauge displaying the average CSAT score across the filtered data |
| KPI Cards | Key metrics including total responses, average score, and response rate |
| Trend Chart | Line chart showing how satisfaction scores have changed over time, with switchable granularity (daily, weekly, monthly) |
| Score Distribution | Bar chart showing how many responses fall into each score bucket (1–5 stars) |
Assignee Report
The Assignee report focuses on per-agent satisfaction performance:
| Component | Description |
|---|---|
| Leaderboard Table | Ranked table of assignees showing average score, total responses, and response breakdown |
| Detail Panel | Click an assignee row to view their individual score distribution and recent feedback |
This report is especially useful for identifying coaching opportunities and recognizing top-performing agents.
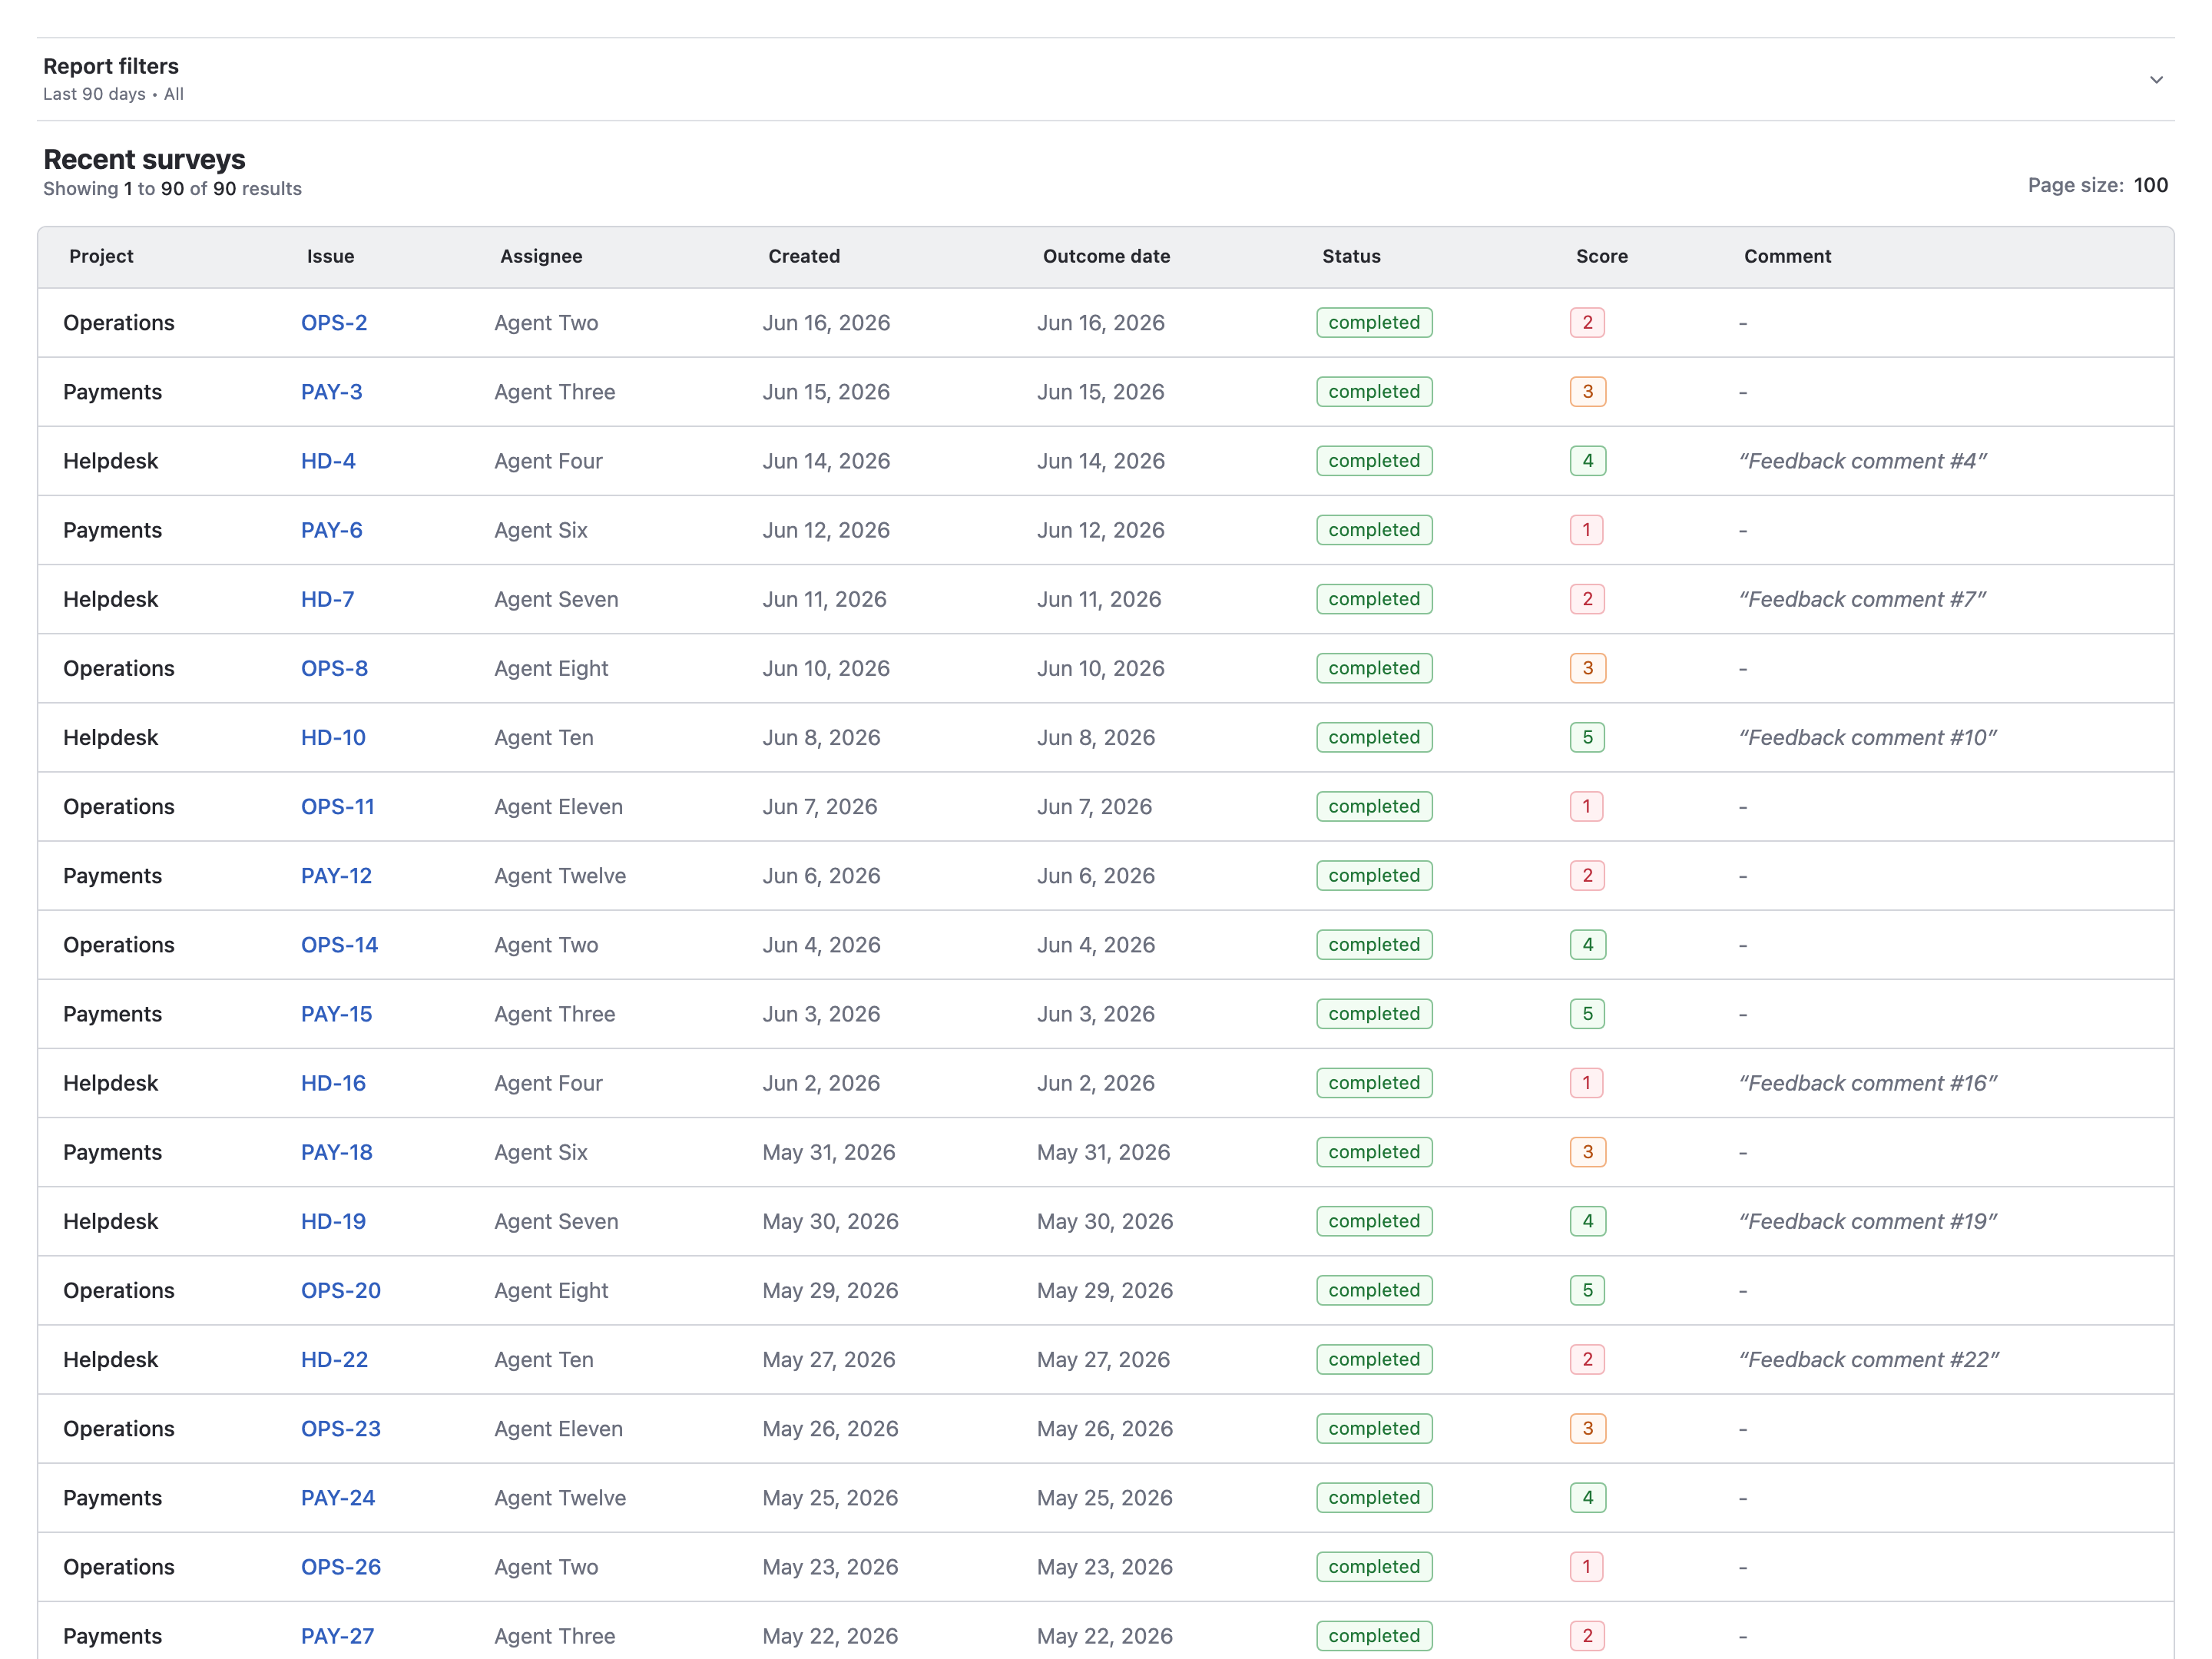
Feedback List Report
The Feedback List report displays individual survey responses in a paginated table:
| Column | Description |
|---|---|
| Issue | Linked issue ID |
| Score | Star rating (1–5) |
| Comment | Customer's optional text comment |
| Assignee | Agent who resolved the issue |
| Reporter | Customer who submitted the feedback |
| Date | When the response was submitted |
The table supports pagination to browse through large volumes of feedback.
Filters & Controls
Each widget includes a collapsible Filters panel at the top. Click the filter header to expand or collapse the controls. A summary of the active filters is shown when the panel is collapsed. Editing filters requires create/configure permission; view-only users see the saved report.
Available Filters
| Filter | Description | Plan Restriction |
|---|---|---|
| Date Range | Pre-set time window: Last 30 days, Last 90 days, or All time | Free plan locked to Last 30 days |
| Status | Filter by survey response status: All, Awaiting, or Completed | — |
| Projects | Comma-separated list of project short names to scope the report | — |
| Scores | Multi-select filter for specific star ratings (e.g., only 1 and 2 star responses) | — |
| Assignees | User picker to filter by one or more assignees | — |
| Reporters | User picker to filter by one or more reporters | — |
| Only with Comments | Toggle to show only responses that include a text comment | — |
| Include Expired | Toggle to include surveys that expired without a response | — |
After adjusting filters, click the Apply button to refresh the report data.
Free Plan Limitation
On the Free plan, the date range is locked to Last 30 days. Upgrade to Starter or above to access 90-day and all-time reporting.
Widget Configuration
Clicking the widget's Configure button (or the gear icon) opens the settings form where you can change the report mode and set a custom widget title.
| Setting | Description |
|---|---|
| Title | Optional custom title displayed in the widget header |
| Report Mode | Select Overall, Assignee, or Feedback List |
Configuration changes are saved per widget instance, so each widget on a dashboard can have independent settings.
If you do not have permission to create and configure reports, existing reports can still be shown when you have view access, but configuration controls are unavailable.
Best Practices
- Use multiple widgets: Place an Overall widget for high-level KPIs alongside a Feedback List widget for detailed drill-down on the same dashboard
- Filter by project: Use the Projects filter to create project-specific dashboards for project leads
- Monitor low scores: Create a widget filtered to scores 1 and 2 to proactively track unsatisfied customers
- Track trends weekly: Use the trend chart's weekly granularity to spot patterns without the noise of daily fluctuations
Need More Help? Contact support@appfero.com or visit our FAQ page.